
1. Overview of Aging2Cancer
2. Expression module
3. Methylation module
4. Genomic module
5. Hallmarks module
6. Immune module
7. Survival module
8. Download
2. Expression module
3. Methylation module
4. Genomic module
5. Hallmarks module
6. Immune module
7. Survival module
8. Download
1. Overview of Aging2Cancer
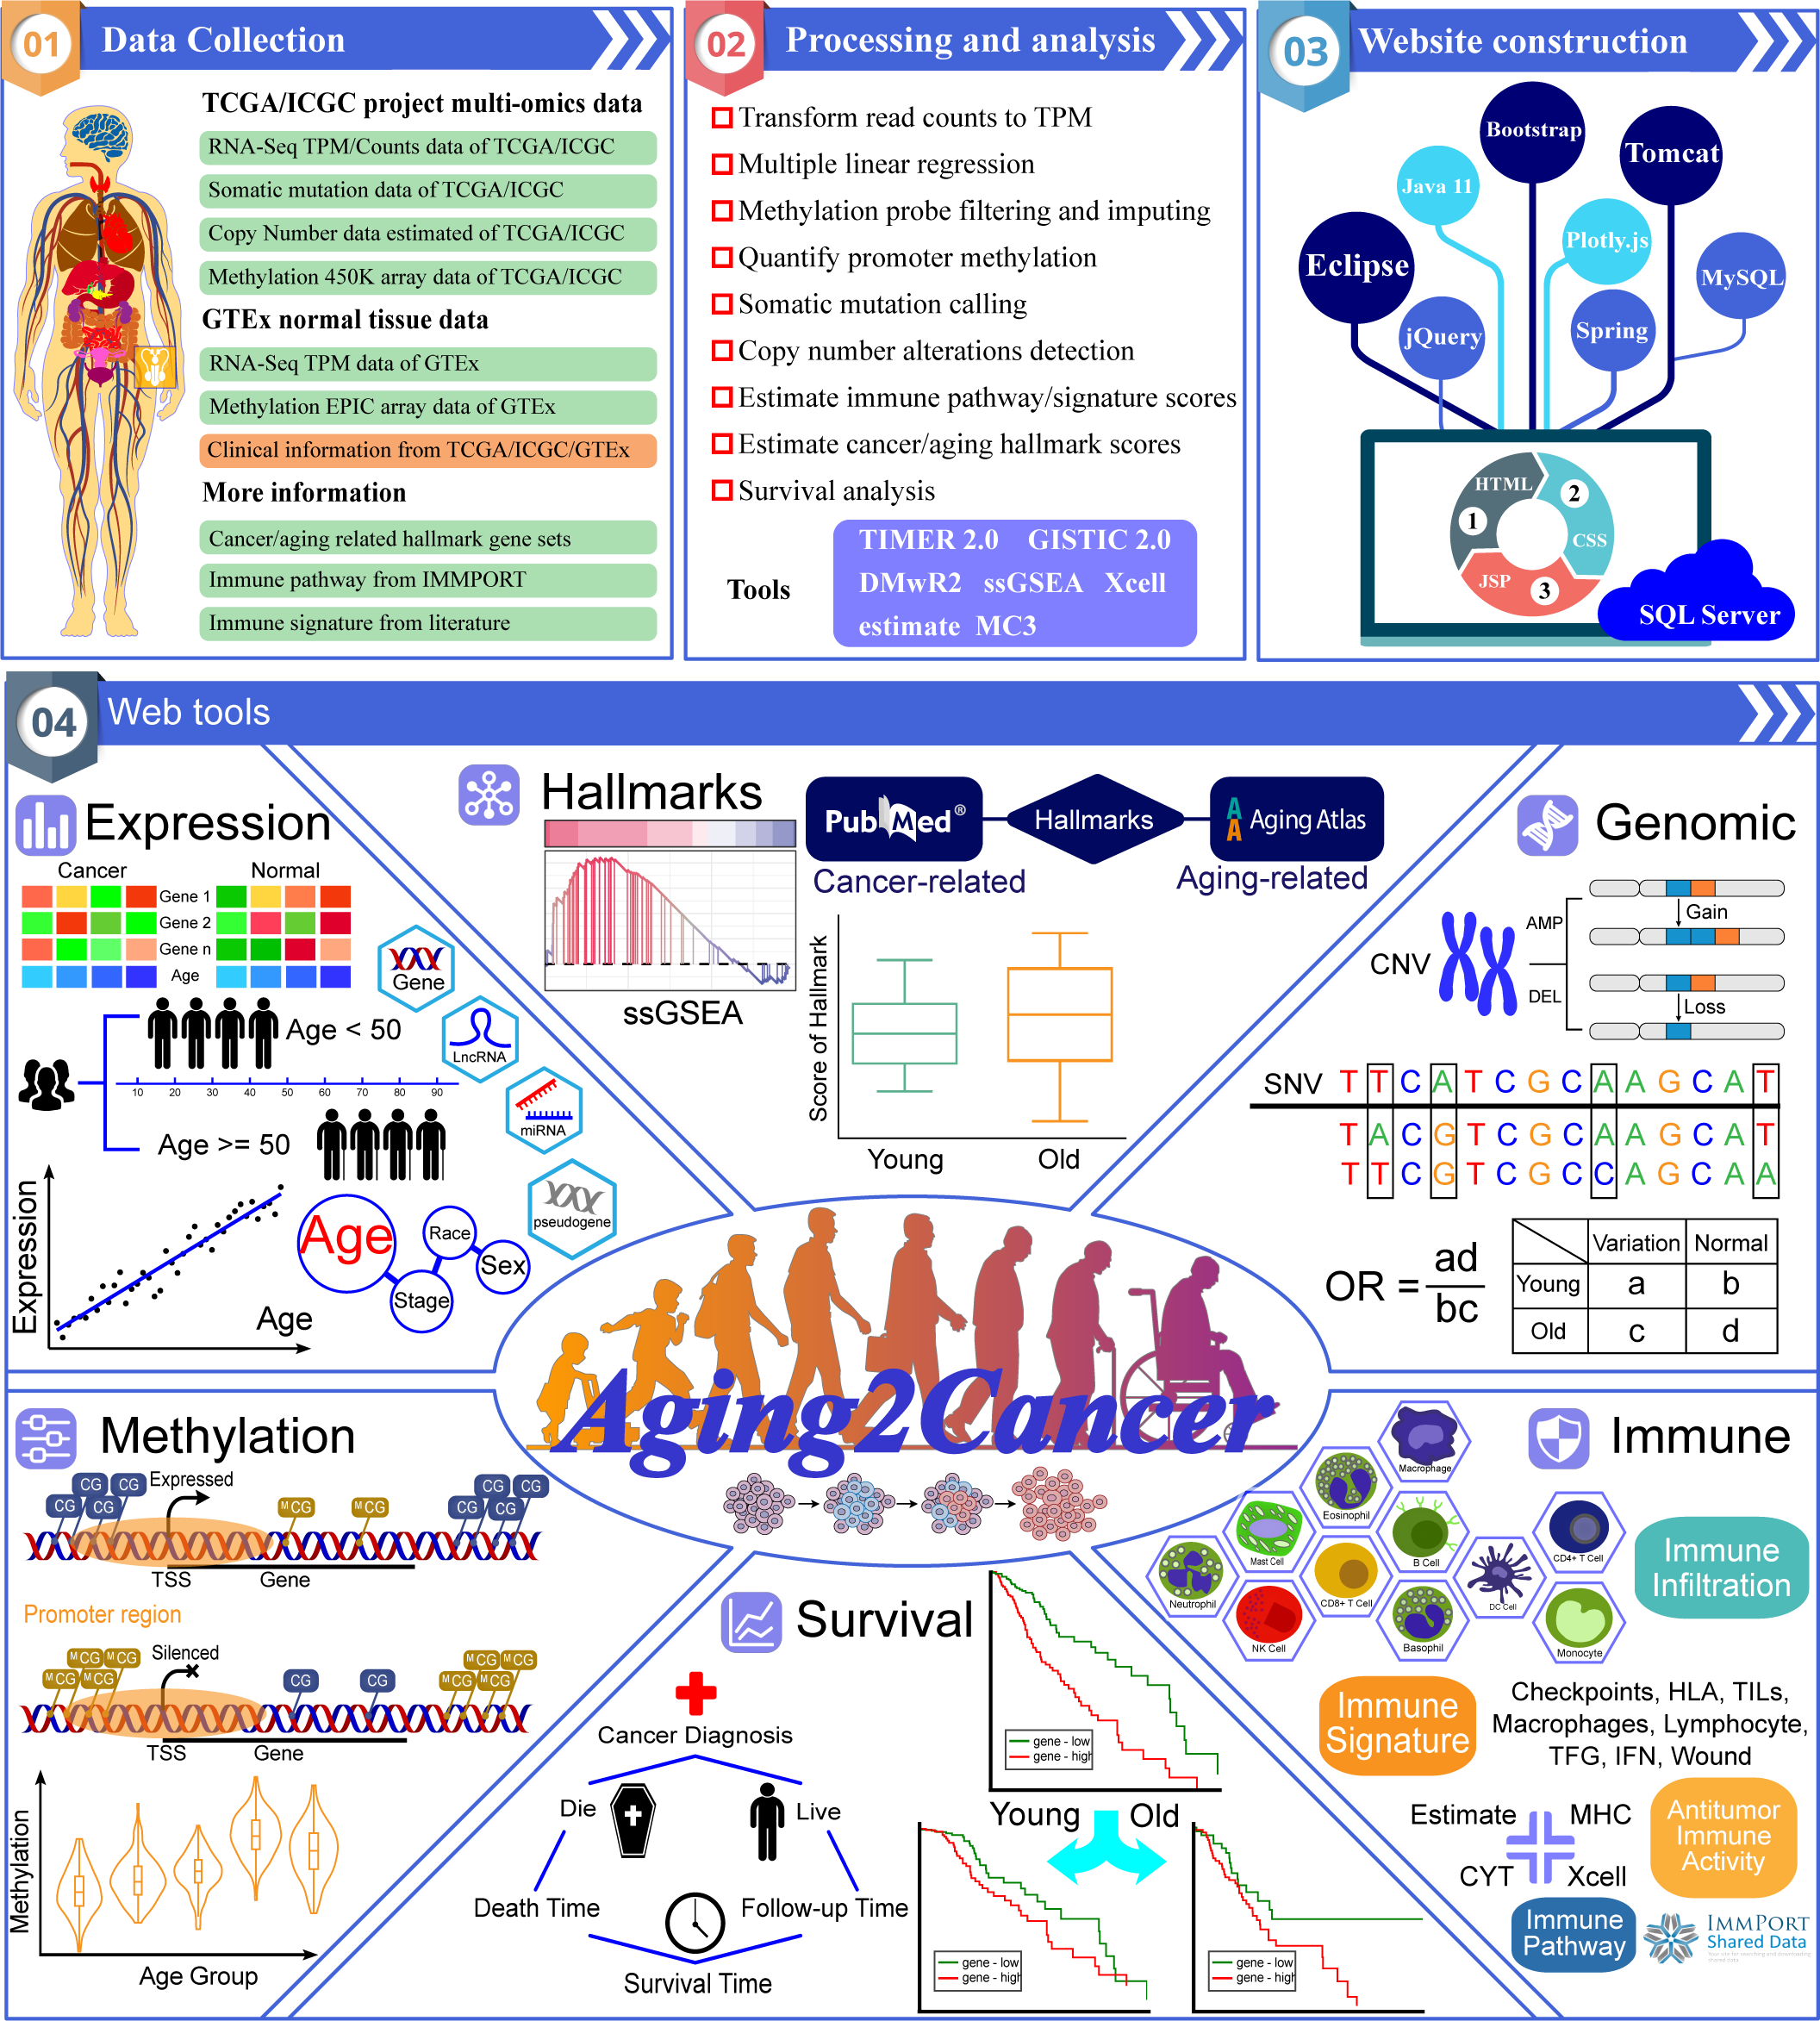
Aging2Cancer is a comprehensive, user-friendly, and interactive web
resource for linking aging to tumor multi-omics data. Aging2Cancer is designed to, a) provide easy access
to publicly available cancer and normal OMICS data with aging information (TCGA, ICGC, and GTEx), b)
allow users to explore the associations between aging and tumor multi-omics characteristics (gene expression
, DNA methylation, single nucleotide variant, and copy number alterations), c) allow users to estimate the
differences in cancer- and aging-related hallmark scores in different age groups, and calculate the
correlation coefficient between gene expression and hallmark scores, d) provide tools to estimate the
differences between age groups for four immune-related modules including immune infiltration, immune
pathway, immune signature, and antitumor immune activity, e) provide plots depicting gene expression
and patient survival information for different age groups. In summary, Aging2Cancer is a valuable
resource for identifying novel biomarkers and will serve as a bridge for linking aging to cancer.

2 Expression module
Users can input gene ensembl ID or symbol, and select a resource and cancer to view the correlations between aging and gene expression in a specific cancer type or normal tissue.
2.1 Single gene expression module
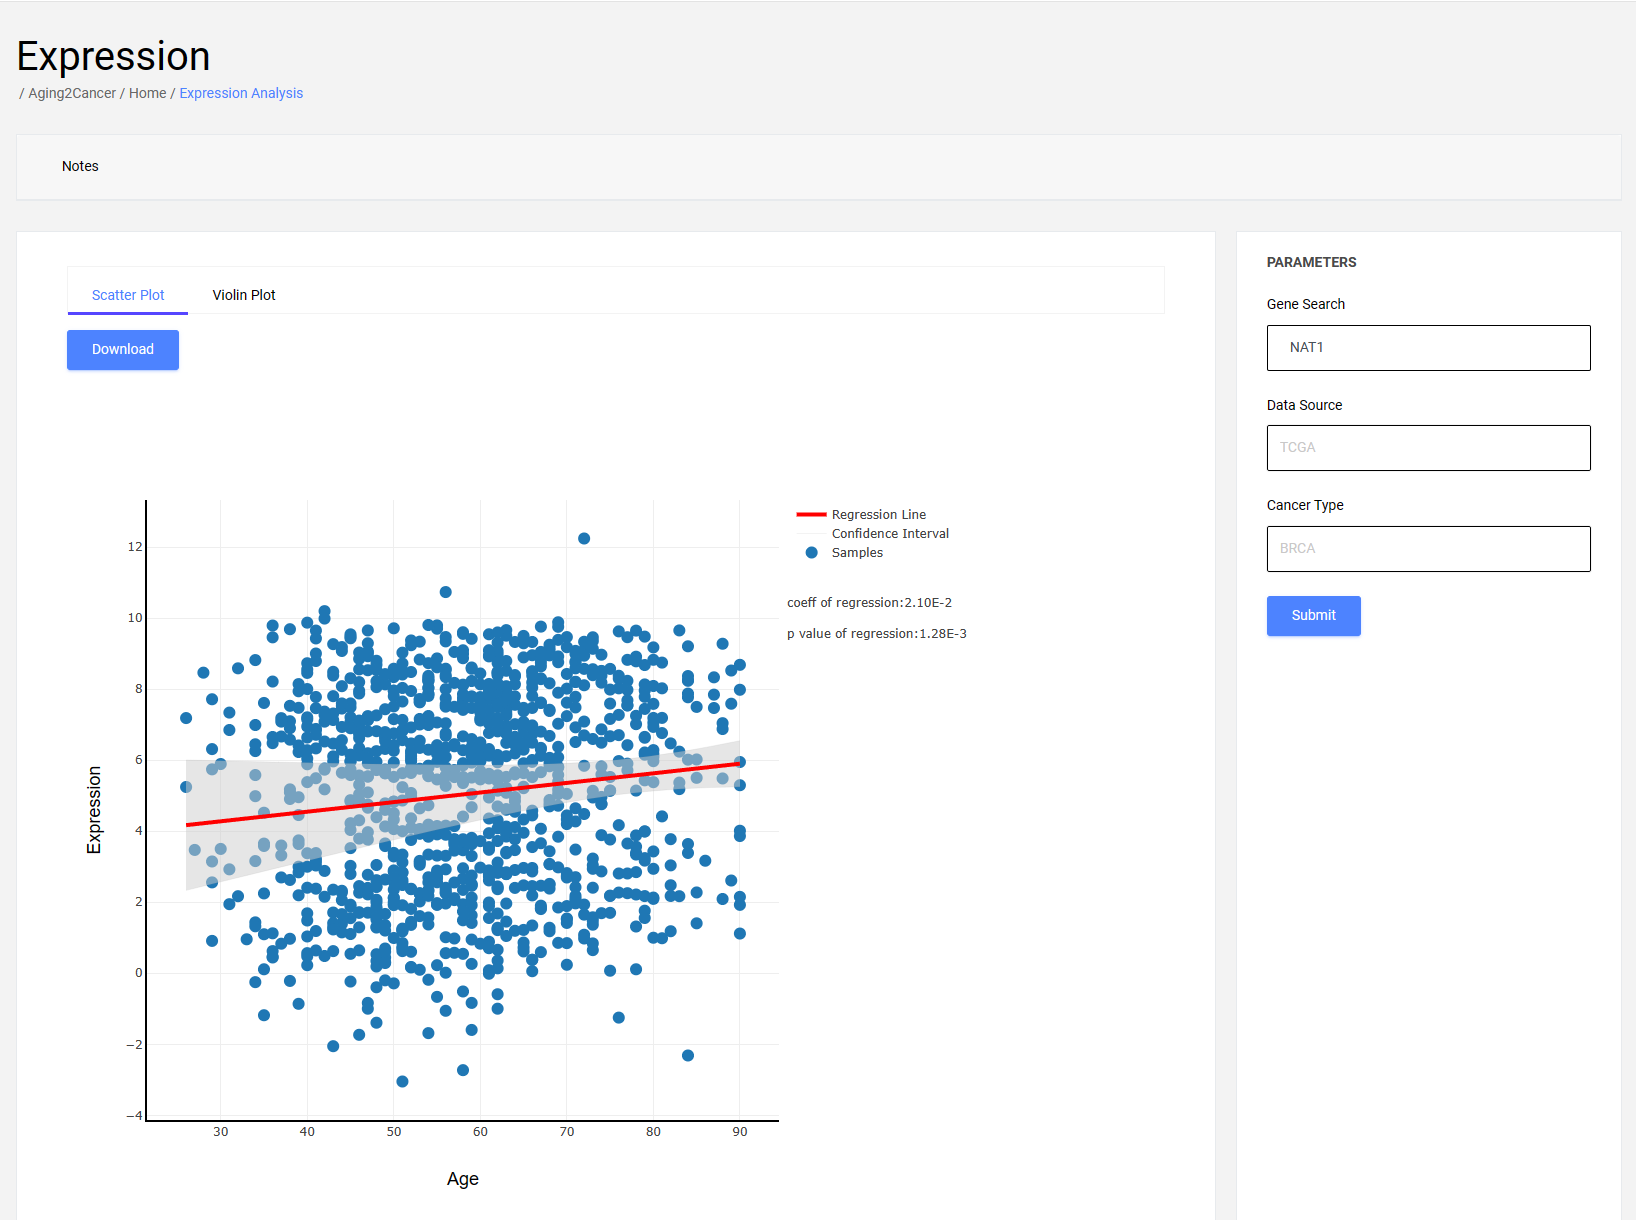
2.1.1 Scatter plot
The scatter plot exhibits the correlation between aging and gene expression. The x-axis is the age information of the samples, and the y-axis is the gene expression of the samples. The regression curve and 95% confidence interval obtained from the linear regression analysis are shown in the figures.
2.1.2 Violin plot
The violin plot exhibits the distribution of gene expression among different decennial groups. The x-axis is the age information of the samples, and the y-axis is the gene expression of the samples.

2.2 Multiple gene expression module
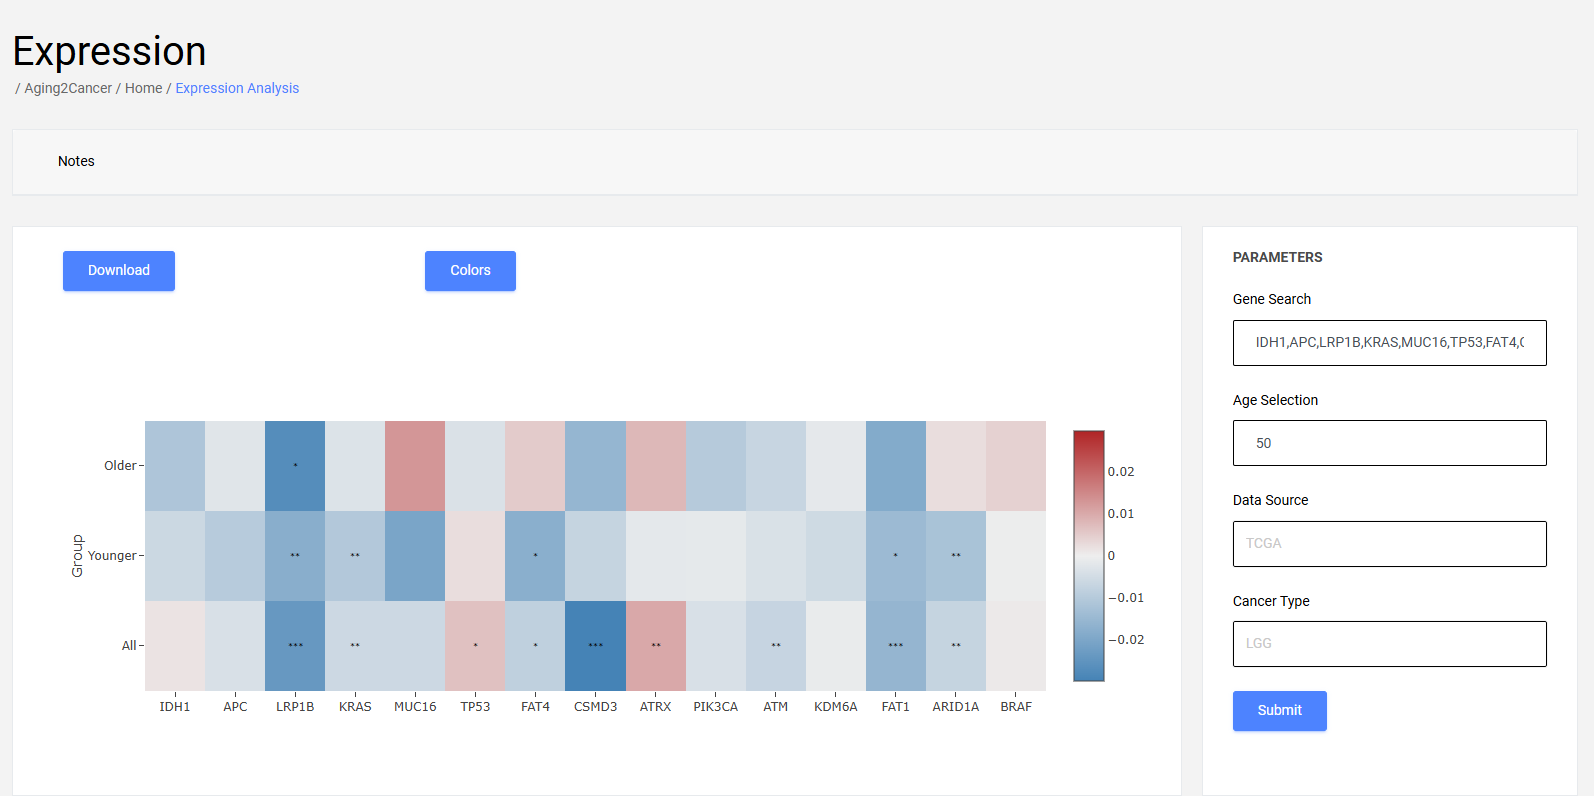
The heatmap plot exhibits the difference in linear combinations of multiple gene expressions between younger and older groups.
Users can input gene ensembl ID or symbol, and select a resource and cancer to view the correlations between aging and gene expression in a specific cancer type or normal tissue.
2.1 Single gene expression module
2.1.1 Scatter plot
The scatter plot exhibits the correlation between aging and gene expression. The x-axis is the age information of the samples, and the y-axis is the gene expression of the samples. The regression curve and 95% confidence interval obtained from the linear regression analysis are shown in the figures.

2.1.2 Violin plot
The violin plot exhibits the distribution of gene expression among different decennial groups. The x-axis is the age information of the samples, and the y-axis is the gene expression of the samples.

2.2 Multiple gene expression module
The heatmap plot exhibits the difference in linear combinations of multiple gene expressions between younger and older groups.

3 Methylation module
Users can input gene ensembl ID or symbol, and select a resource and cancer to view the correlations between aging and gene methylation in a specific cancer type or normal tissue.
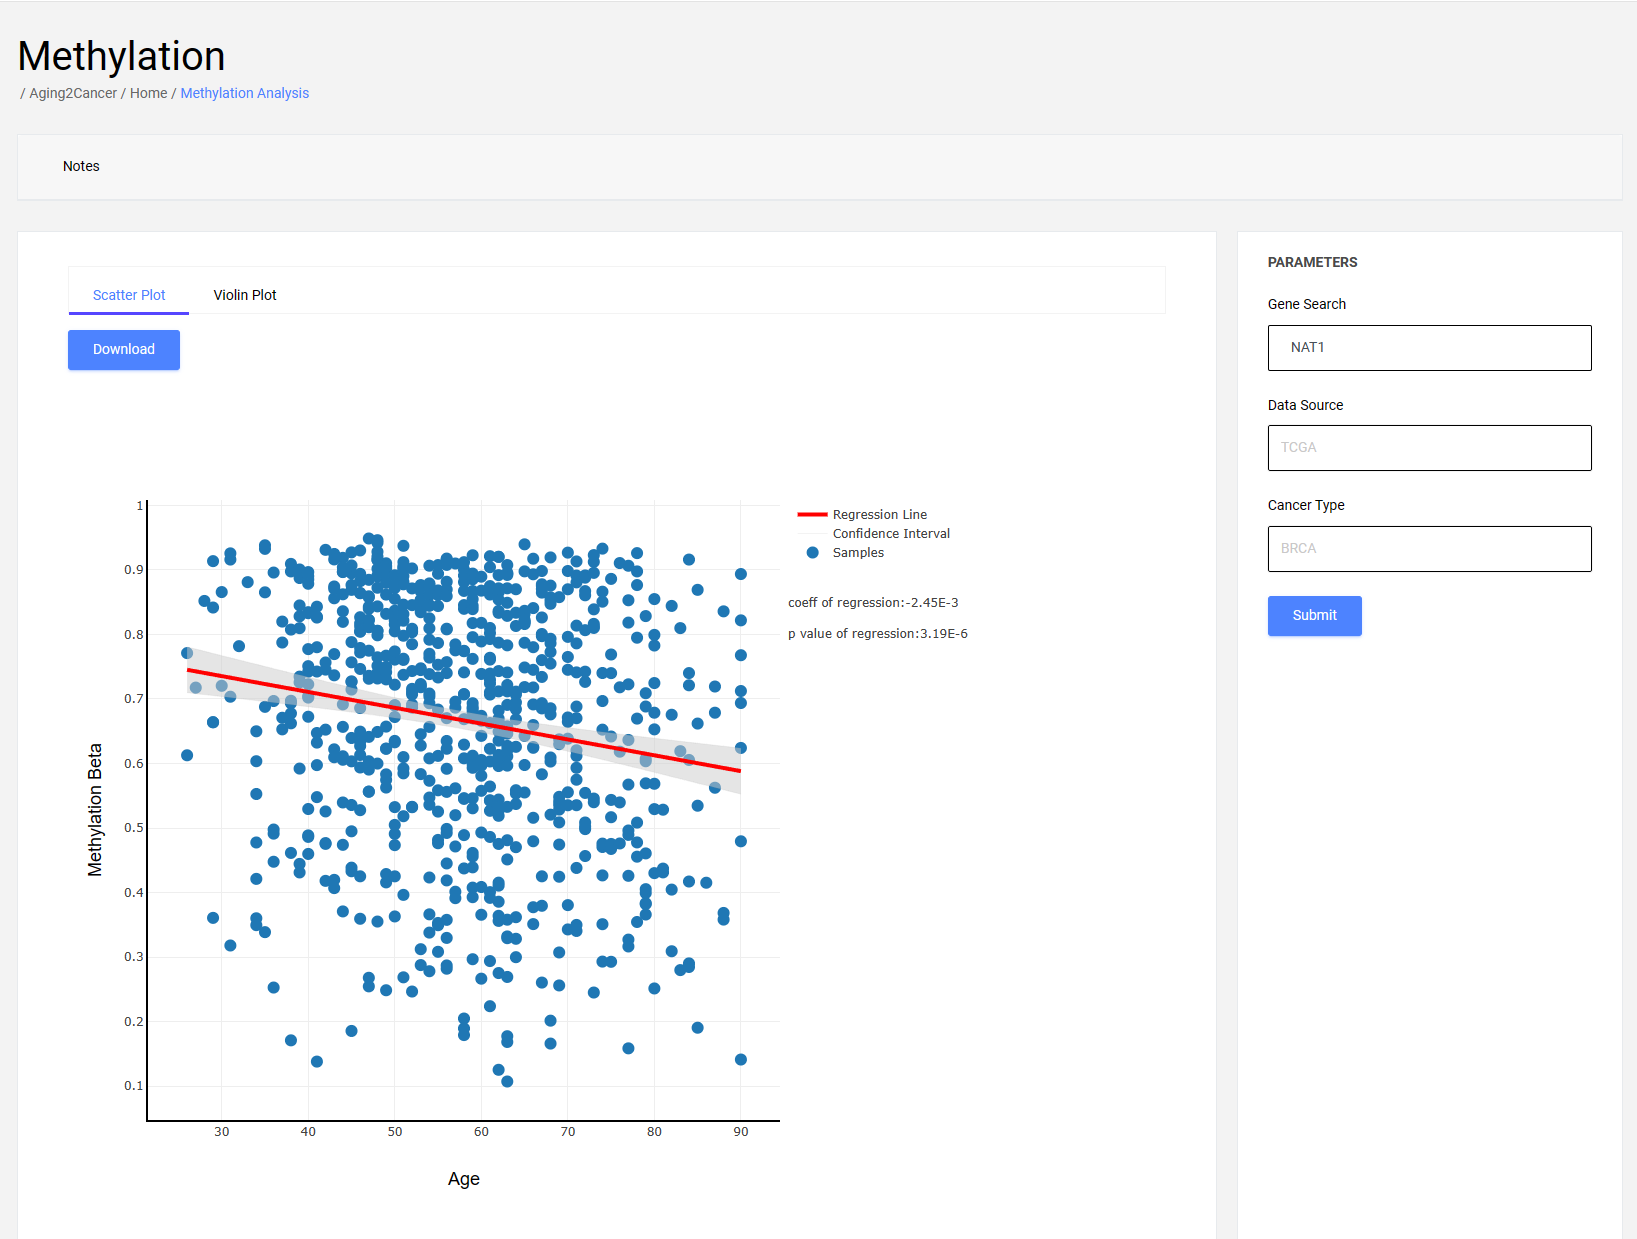
3.1 Scatter plot
The scatter plot exhibits the correlation between aging and gene methylation. The x-axis is the age information of the samples, and the y-axis is the gene methylation of the samples. The regression curve and 95% confidence interval obtained from the linear regression analysis are shown in the figures.
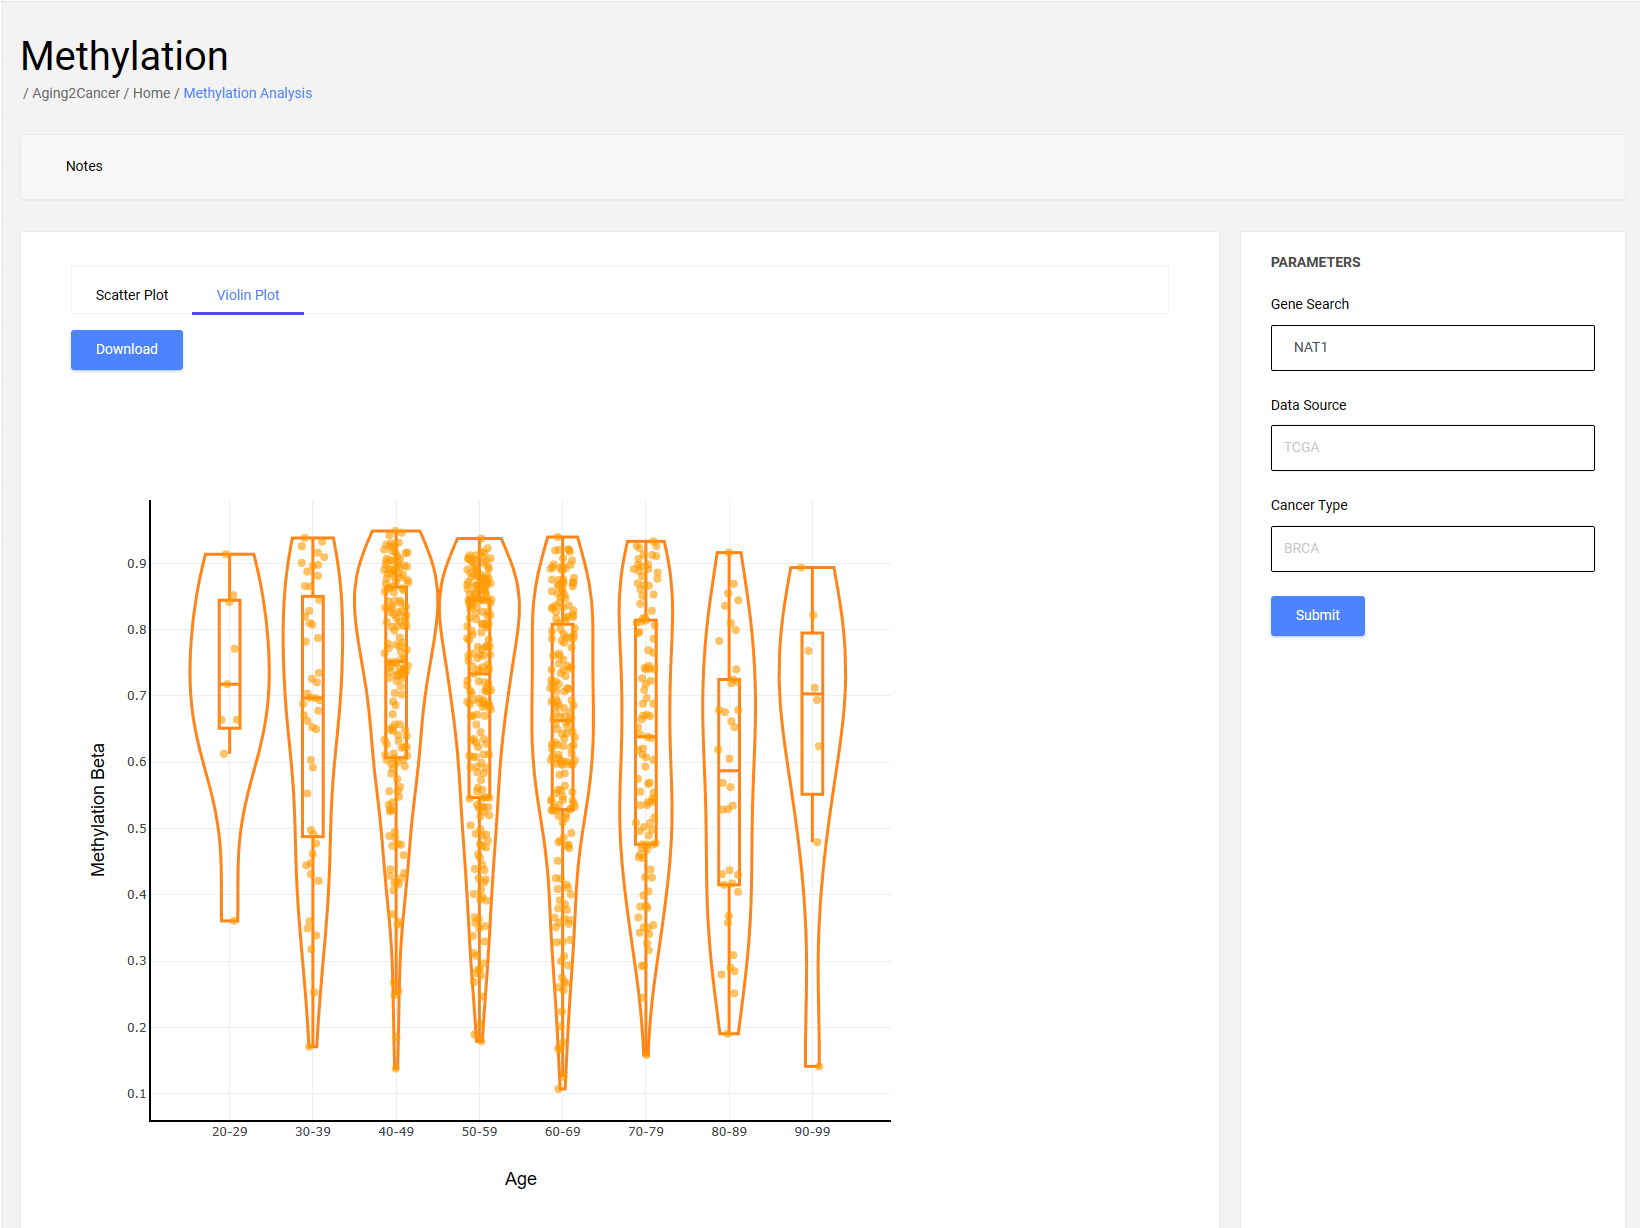
3.2 Violin plot
The violin plot exhibits the distribution of gene methylation among different decennial groups. The x-axis is the age information of the samples, and the y-axis is the gene methylation of the samples.
Users can input gene ensembl ID or symbol, and select a resource and cancer to view the correlations between aging and gene methylation in a specific cancer type or normal tissue.
3.1 Scatter plot
The scatter plot exhibits the correlation between aging and gene methylation. The x-axis is the age information of the samples, and the y-axis is the gene methylation of the samples. The regression curve and 95% confidence interval obtained from the linear regression analysis are shown in the figures.

3.2 Violin plot
The violin plot exhibits the distribution of gene methylation among different decennial groups. The x-axis is the age information of the samples, and the y-axis is the gene methylation of the samples.

4 Genomic module
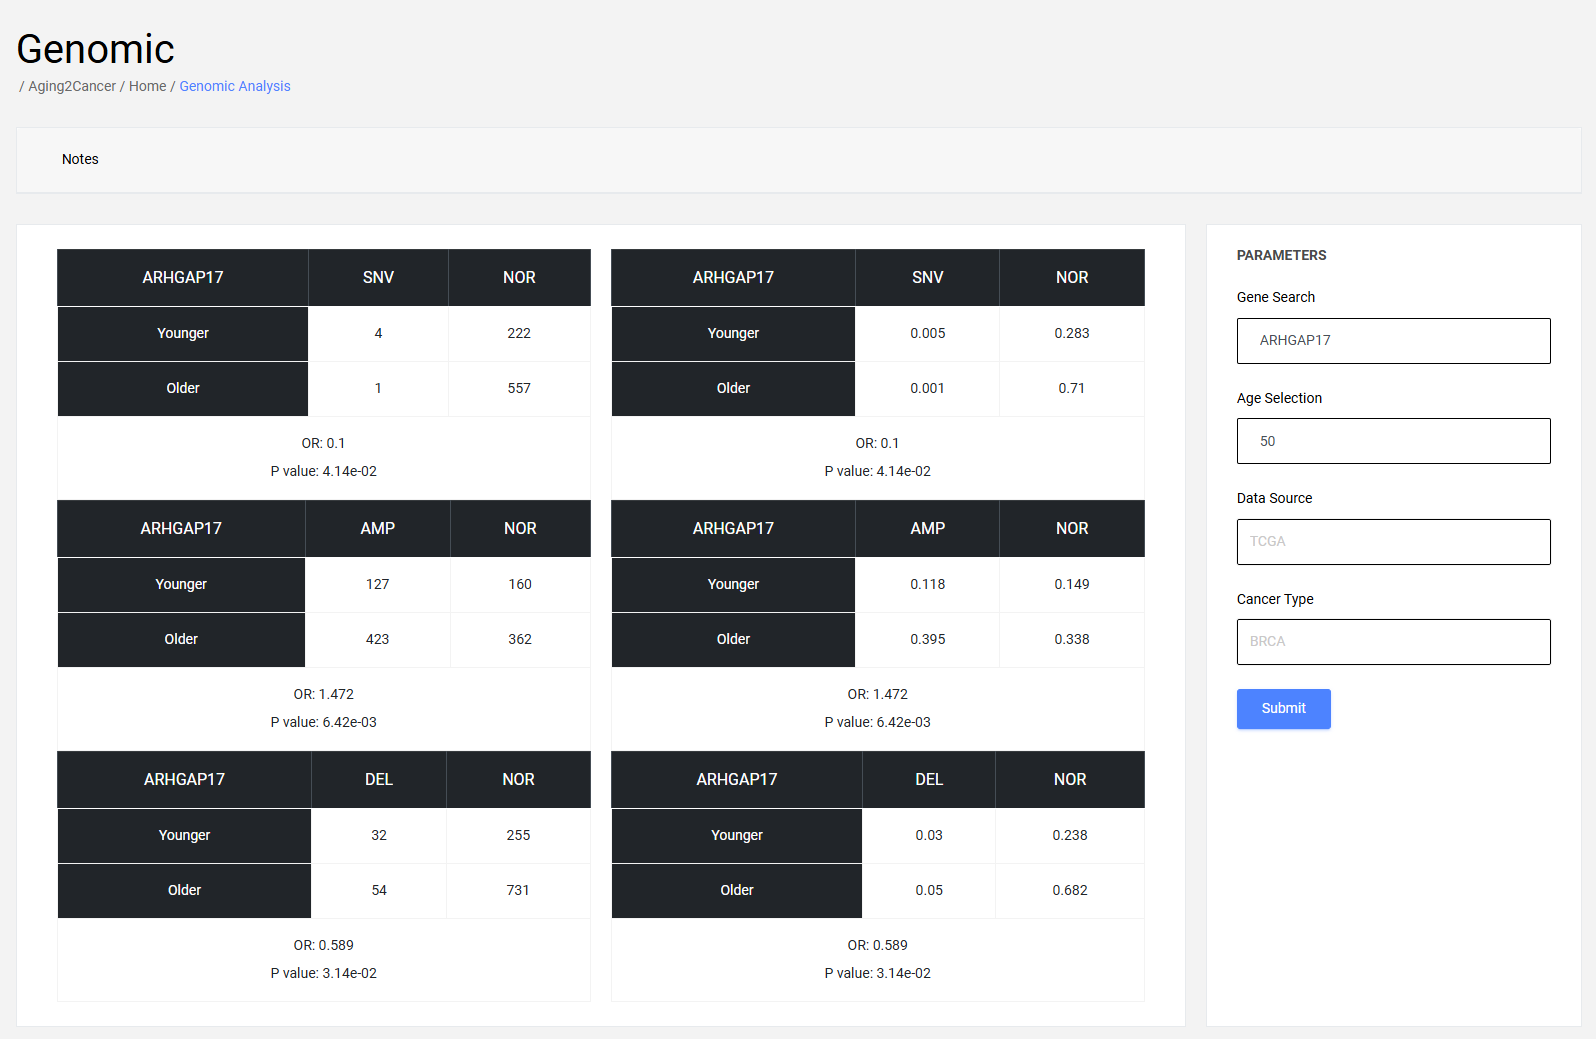
4.1 Single gene module
The differences of the number/frequency for copy number amplification, copy number deletion, and single nucleotide variation for a specific gene are calculated through the Chi-square test.
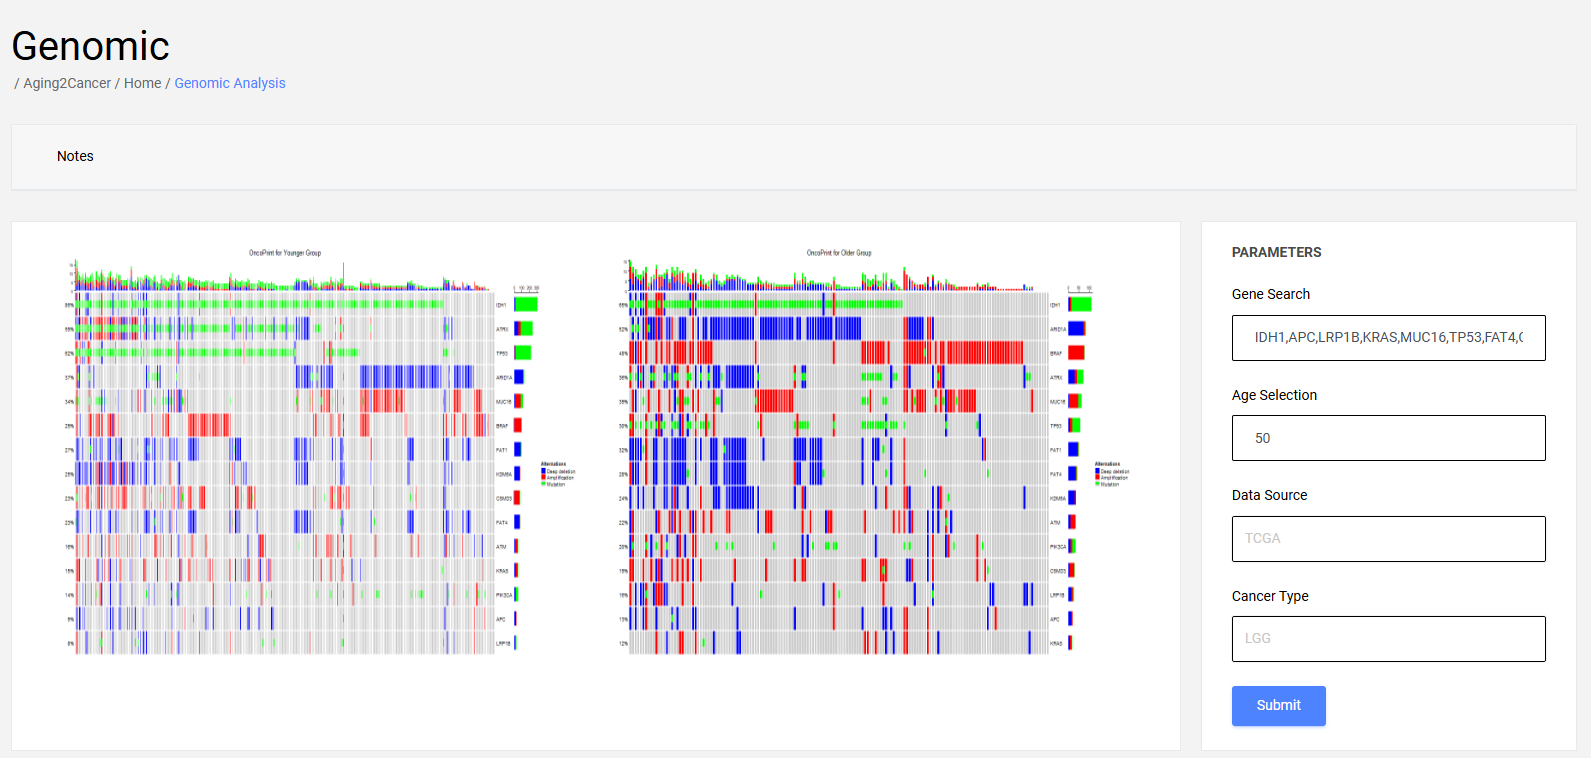
4.2 Multiple gene module
The differences in genomic alteration patterns including copy number amplification, copy number deletion, and single nucleotide variation for multiple genes between younger and older groups is exhibited with oncoprint plot.
4.1 Single gene module
The differences of the number/frequency for copy number amplification, copy number deletion, and single nucleotide variation for a specific gene are calculated through the Chi-square test.

4.2 Multiple gene module
The differences in genomic alteration patterns including copy number amplification, copy number deletion, and single nucleotide variation for multiple genes between younger and older groups is exhibited with oncoprint plot.

5 Hallmarks module
Users can input gene ensembl ID or symbol, and select a resource, cancer, and an aging/cancer hallmark to view the correlations between the hallmarks and gene expression in a specific cancer type. In addition, users can submit their custom gene sets and explore their associations with aging.
5.1 Box plot
The box plot exhibits the differences in activity of specific hallmarks between younger and older patients.
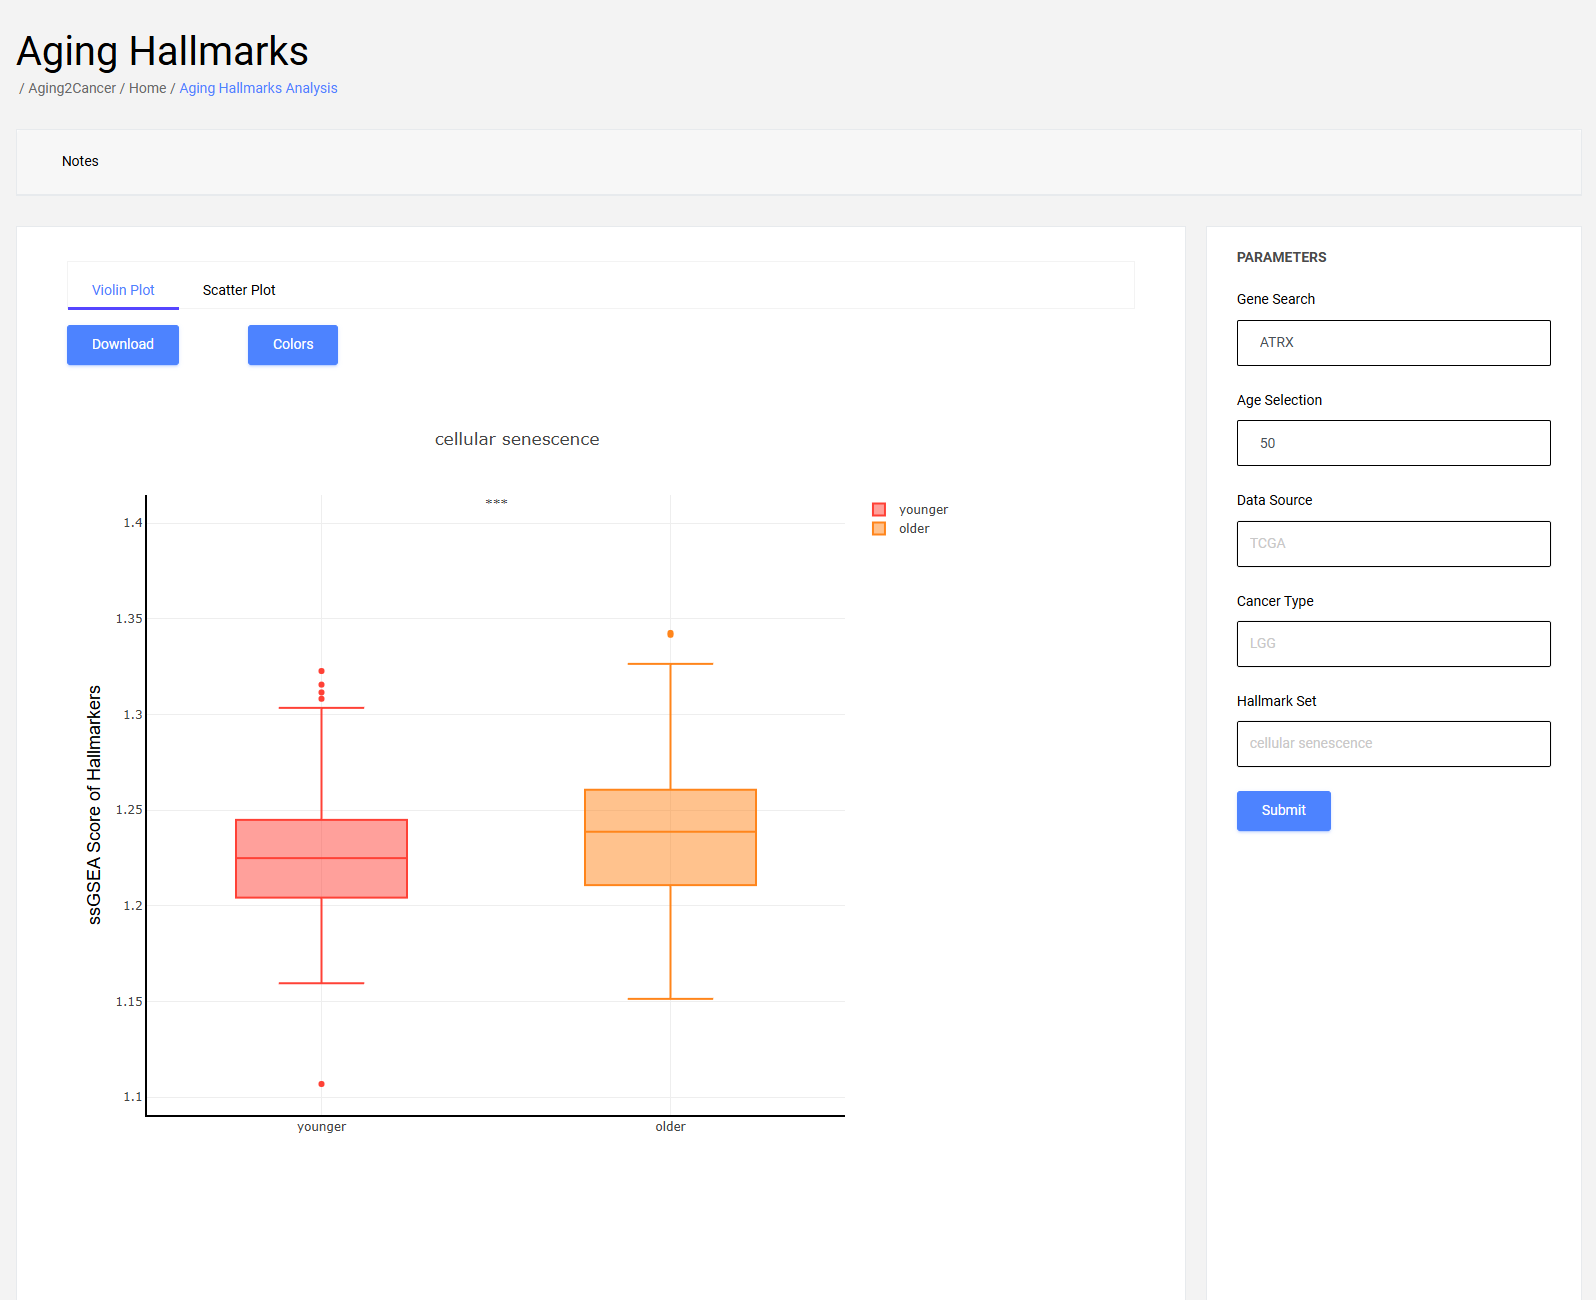
The differences in all hallmarks between younger and older are shown with the “All” parameter for the hallmark set.

5.2 Scatter plot
The scatter plot exhibits the correlation between hallmarks and gene expression. The x-axis is the activities of the hallmark, and the y-axis is the gene expression of the samples.
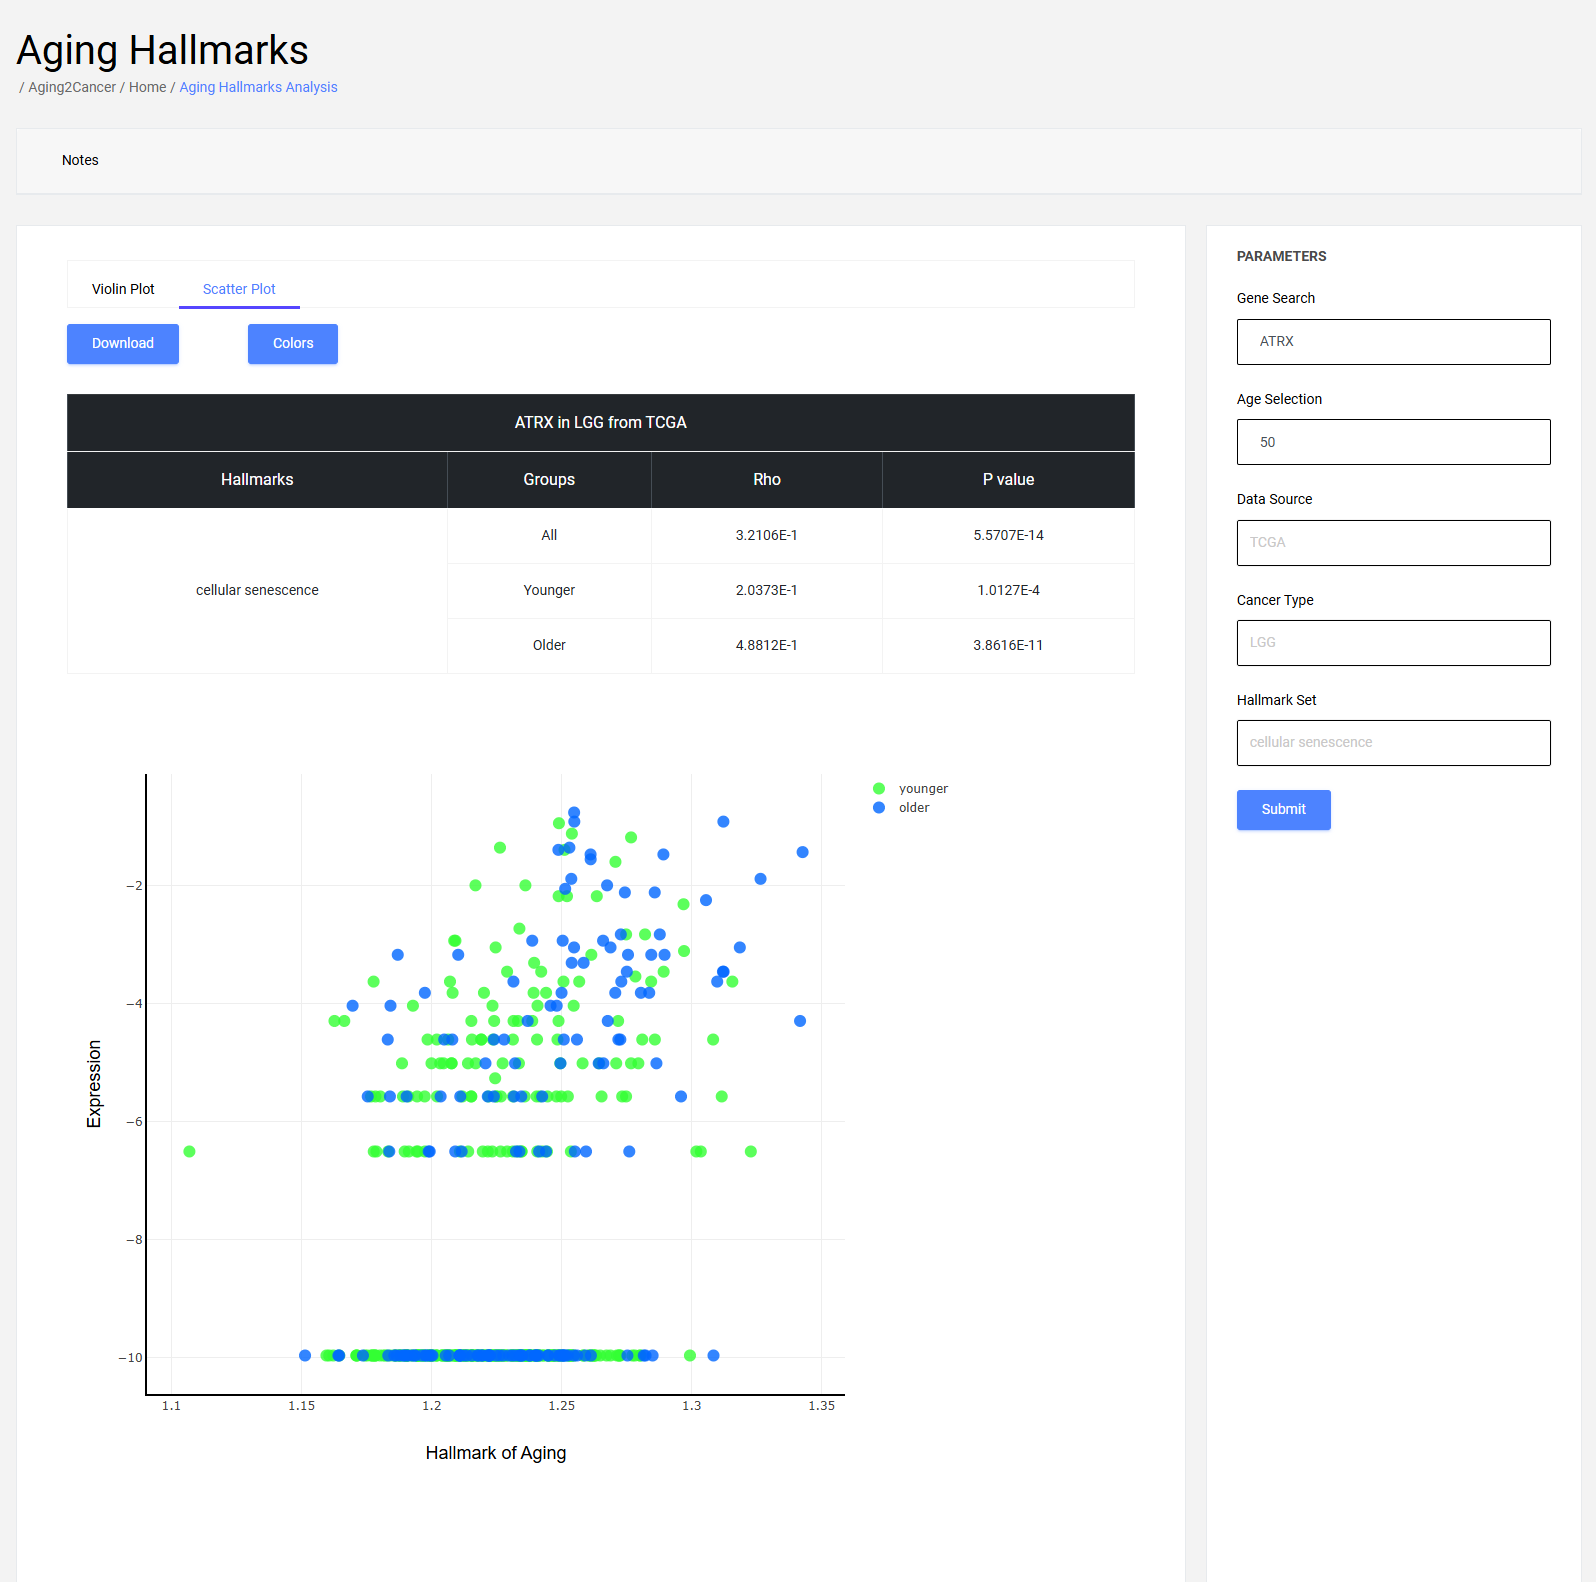
Users can input gene ensembl ID or symbol, and select a resource, cancer, and an aging/cancer hallmark to view the correlations between the hallmarks and gene expression in a specific cancer type. In addition, users can submit their custom gene sets and explore their associations with aging.
5.1 Box plot
The box plot exhibits the differences in activity of specific hallmarks between younger and older patients.

The differences in all hallmarks between younger and older are shown with the “All” parameter for the hallmark set.

5.2 Scatter plot
The scatter plot exhibits the correlation between hallmarks and gene expression. The x-axis is the activities of the hallmark, and the y-axis is the gene expression of the samples.

6 Immune module
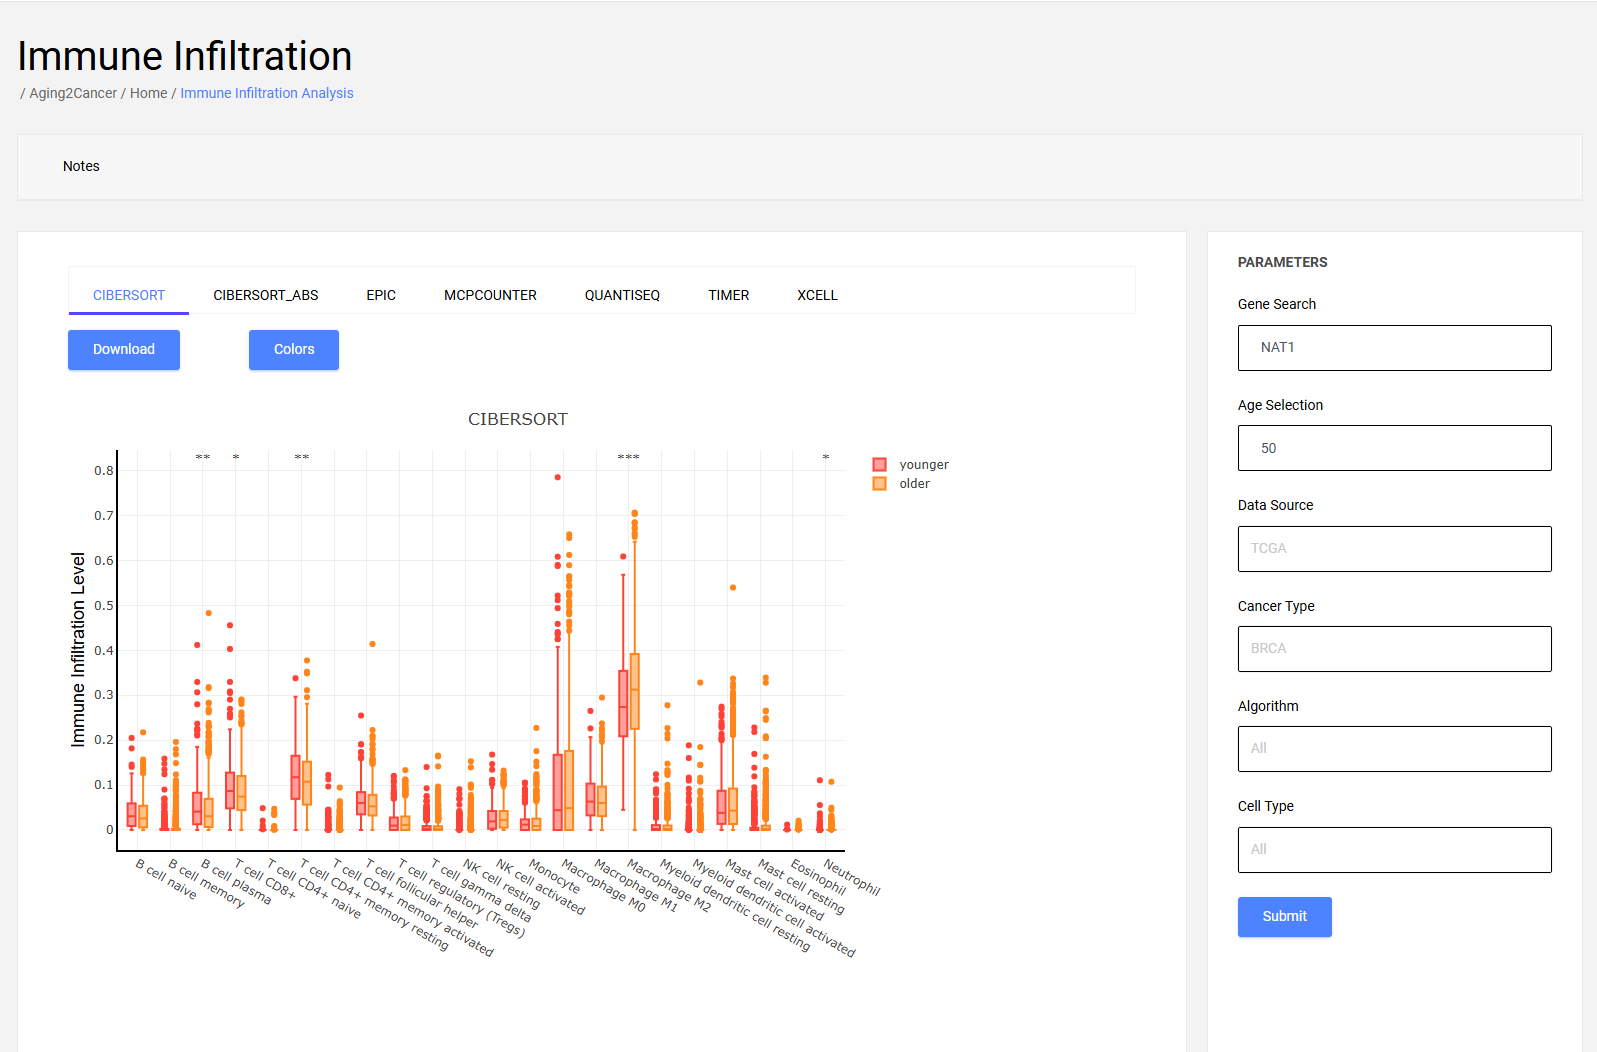
The immune module contains immune infiltration, immune pathway, immune signature, and antitumor immune activity. Users can input gene ensembl ID or symbol, and select a resource, cancer, and an immune-related catalog to view the correlations between the immune score and gene expression in a specific cancer type.
6.1 Box plot
The box plot exhibits the differences in scores of specific immune-related catalogs between younger and older patients. The differences in all immune-related catalogs between younger and older are shown with the “All” parameter.
6.2 Scatter plot
The scatter plot exhibits the correlation between immune score and gene expression. The x-axis is the score of the immune-related catalog, and the y-axis is the gene expression of the samples.
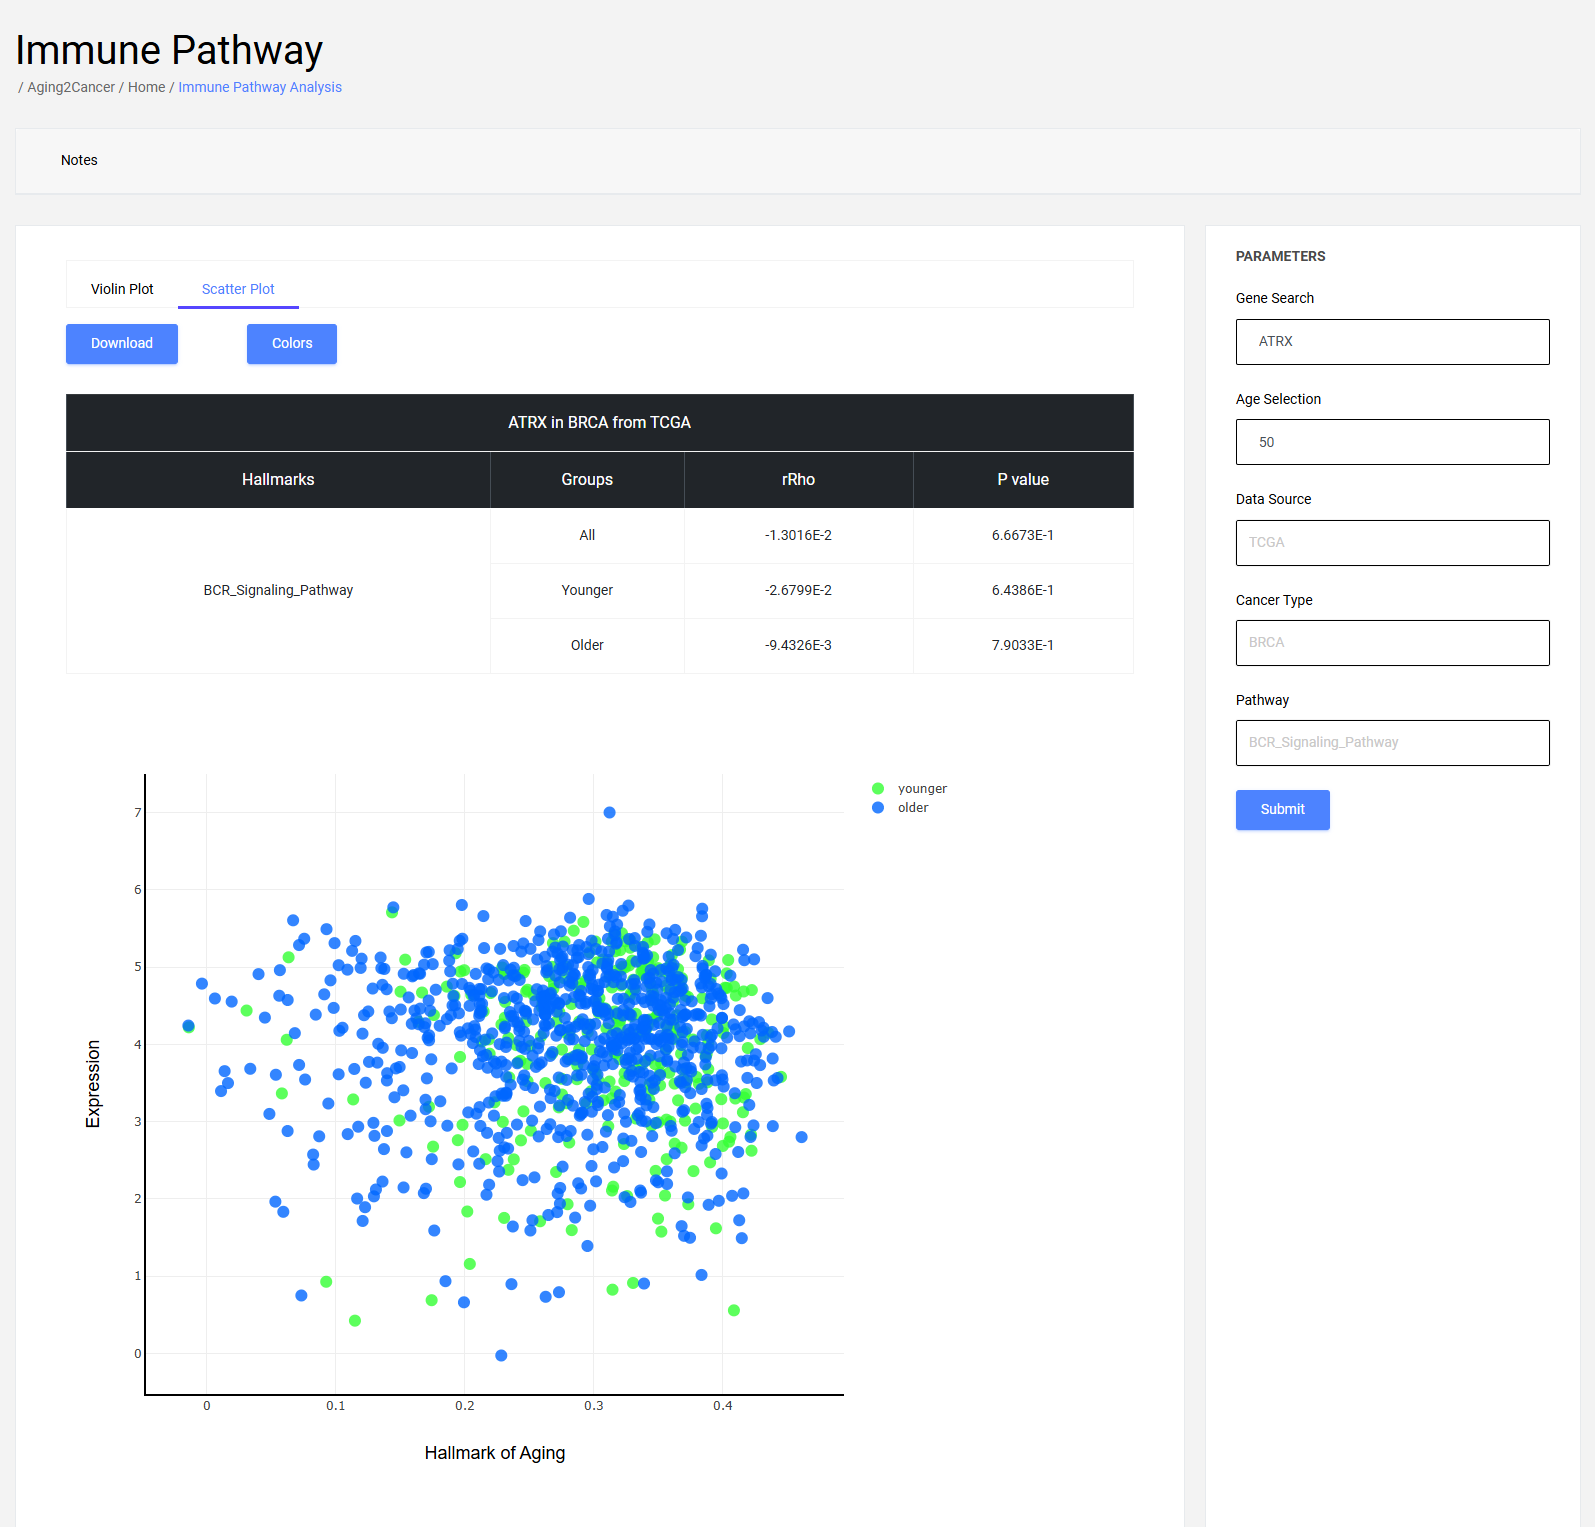
The immune module contains immune infiltration, immune pathway, immune signature, and antitumor immune activity. Users can input gene ensembl ID or symbol, and select a resource, cancer, and an immune-related catalog to view the correlations between the immune score and gene expression in a specific cancer type.
6.1 Box plot
The box plot exhibits the differences in scores of specific immune-related catalogs between younger and older patients. The differences in all immune-related catalogs between younger and older are shown with the “All” parameter.

6.2 Scatter plot
The scatter plot exhibits the correlation between immune score and gene expression. The x-axis is the score of the immune-related catalog, and the y-axis is the gene expression of the samples.

7 Survival module
Users can input gene ensembl ID or symbol, and select a resource, cancer to perform survival analysis which combines gene omics features (expression, methylation, genomic) and age information in a specific cancer type.
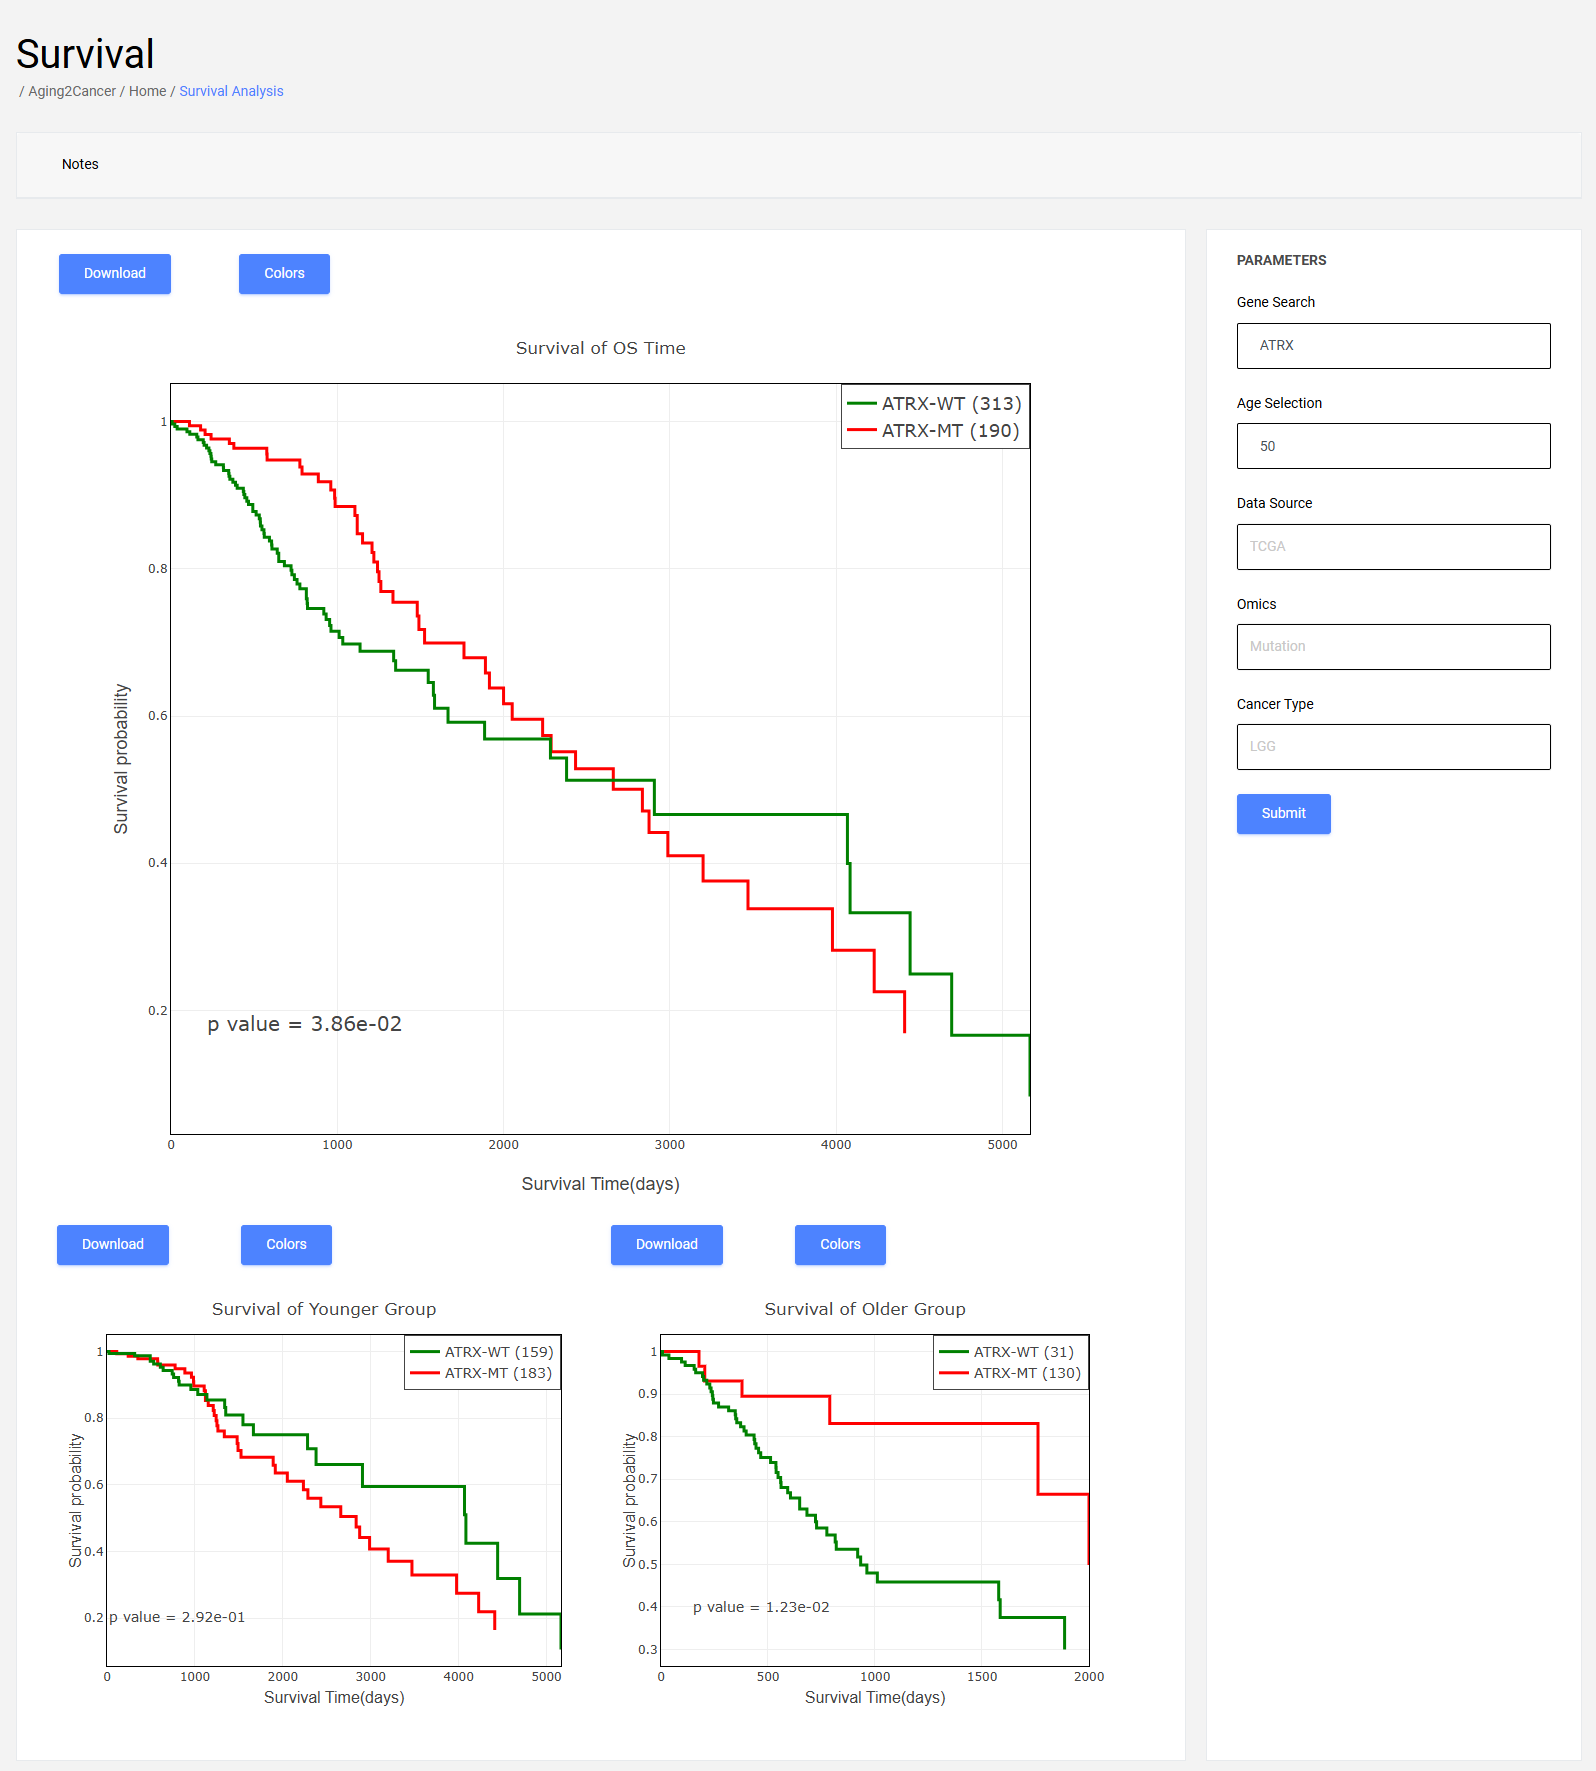
Users can input gene ensembl ID or symbol, and select a resource, cancer to perform survival analysis which combines gene omics features (expression, methylation, genomic) and age information in a specific cancer type.

8 Download
In addition, download links are provided, which allow the user to download the information they are interested in.

In addition, download links are provided, which allow the user to download the information they are interested in.
